Mastering Distributed Tracing with Grafana Tempo and the OTEL Collector
In the world of microservices and cloud-native applications, monitoring and debugging distributed systems can be a complex task. Tracing plays a crucial role in understanding how requests flow through various services and identifying bottlenecks, errors, or latency issues. In this blog post, we'll dive deep into Grafana Tempo and the OpenTelemetry (OTEL) Collector, showing you how to set up and utilize this powerful combination for effective distributed tracing.
1. What is Grafana Tempo and the OTEL Collector?
Grafana Tempo is a high-volume, minimal dependency distributed tracing backend developed by Grafana Labs. It supports a variety of tracing formats, including Jaeger, Zipkin, OpenTelemetry, and others. Tempo is designed to be cost-efficient and scalable, making it an ideal choice for organizations looking to implement tracing without the overhead of managing complex infrastructure.
The OTEL Collector is a vendor-neutral component for receiving, processing, and exporting telemetry data (metrics, logs, and traces). It acts as a centralized agent where telemetry data from multiple sources is collected, processed (if necessary), and then sent to one or more backends for storage and analysis. The OpenTelemetry project aims to provide open standards and tools for observability, making it easier to instrument and monitor applications across a variety of languages and frameworks.
2. Why use Grafana Tempo for Distributed Tracing?
Grafana Tempo offers a compelling set of features that make it an excellent choice for distributed tracing:
- Scalability: Built on top of object storage (such as Amazon S3, Google Cloud Storage, or any S3-compatible storage solution), Tempo can handle large volumes of trace data efficiently.
- Cost-Efficiency: Tempo uses a columnar storage format called TraceV2 which compresses traces effectively, reducing storage costs.
- Integration with Grafana: Since Tempo is tightly integrated with Grafana, you can visualize and query your traces directly from Grafana dashboards, making it a seamless part of your observability stack.
- Support for Multiple Trace Formats: Whether you're using Jaeger, Zipkin, or OpenTelemetry, Tempo can ingest a wide range of trace formats, providing flexibility in data collection.
3. Setting Up the OTEL Collector to Send Traces to Grafana Tempo
Let’s walk through the steps of setting up an OTEL Collector to send traces to a Grafana Tempo instance. The OTEL Collector can be deployed as a binary or on Kubernetes via a Helm chart or a YAML manifest.
- Install the OTEL Collector: First, download and install the OTEL Collector. For a binary installation, you can download the appropriate binary for your operating system from the OpenTelemetry Collector Releases GitHub page.
- Configuration: Create a configuration file named
otel-collector-config.yaml. This file should include a receiver for your specific tracing data format (e.g., OTLP, Jaeger, Zipkin), a processor to batch the traces (as batching can significantly improve performance), and an exporter to send data to Grafana Tempo. - Replace
- Run the Collector: Start the OTEL Collector using the following command with your configuration file:
./otelcol --config=otel-collector-config.yaml
- Instrument Your Application: Make sure your application is instrumented using OpenTelemetry libraries in the language your application is built in. The OpenTelemetry SDKs for various languages (e.g., Java, Python, Go) provide a way to generate trace data and send it to the OTEL Collector endpoint (typically on port 4317 for OTLP over gRPC or port 4318 for OTLP over HTTP).
receivers:
  otlp:
    protocols:
      grpc:
      http:

processors:
  batch:

exporters:
  otlp/grafana:
    endpoint: ":4317"
    tls:
      insecure: true # Only for testing purposes. For production, specify TLS configuration.

service:
  pipelines:
    traces:
      receivers: [otlp]
      processors: [batch]
      exporters: [otlp/grafana]
4. Visualizing Traces in Grafana
Once your application is generating traces and your OTEL Collector is sending them to Tempo, you need to configure Grafana to visualize these traces:
- Add Grafana Tempo as a Data Source in Grafana:
- Go to the Grafana web interface and navigate to "Configuration" > "Data sources".
- Click on "Add data source" and search for "Tempo".
- Enter the URL where your Tempo instance is running (usually something like
http://tempo:3100if it’s running in the same Kubernetes cluster or a server accessible by Grafana). - Click "Save & Test" to verify the connection to Tempo.
- Query Traces in Grafana:
- Once your Tempo data source is added, you can query traces from the "Explore" section in Grafana. Select the "Tempo" data source.
- You can query traces by Trace ID, service name, operation name, tags, and more. Grafana provides a user-friendly interface for exploring and analyzing trace data.
- Integration with Grafana Dashboards:
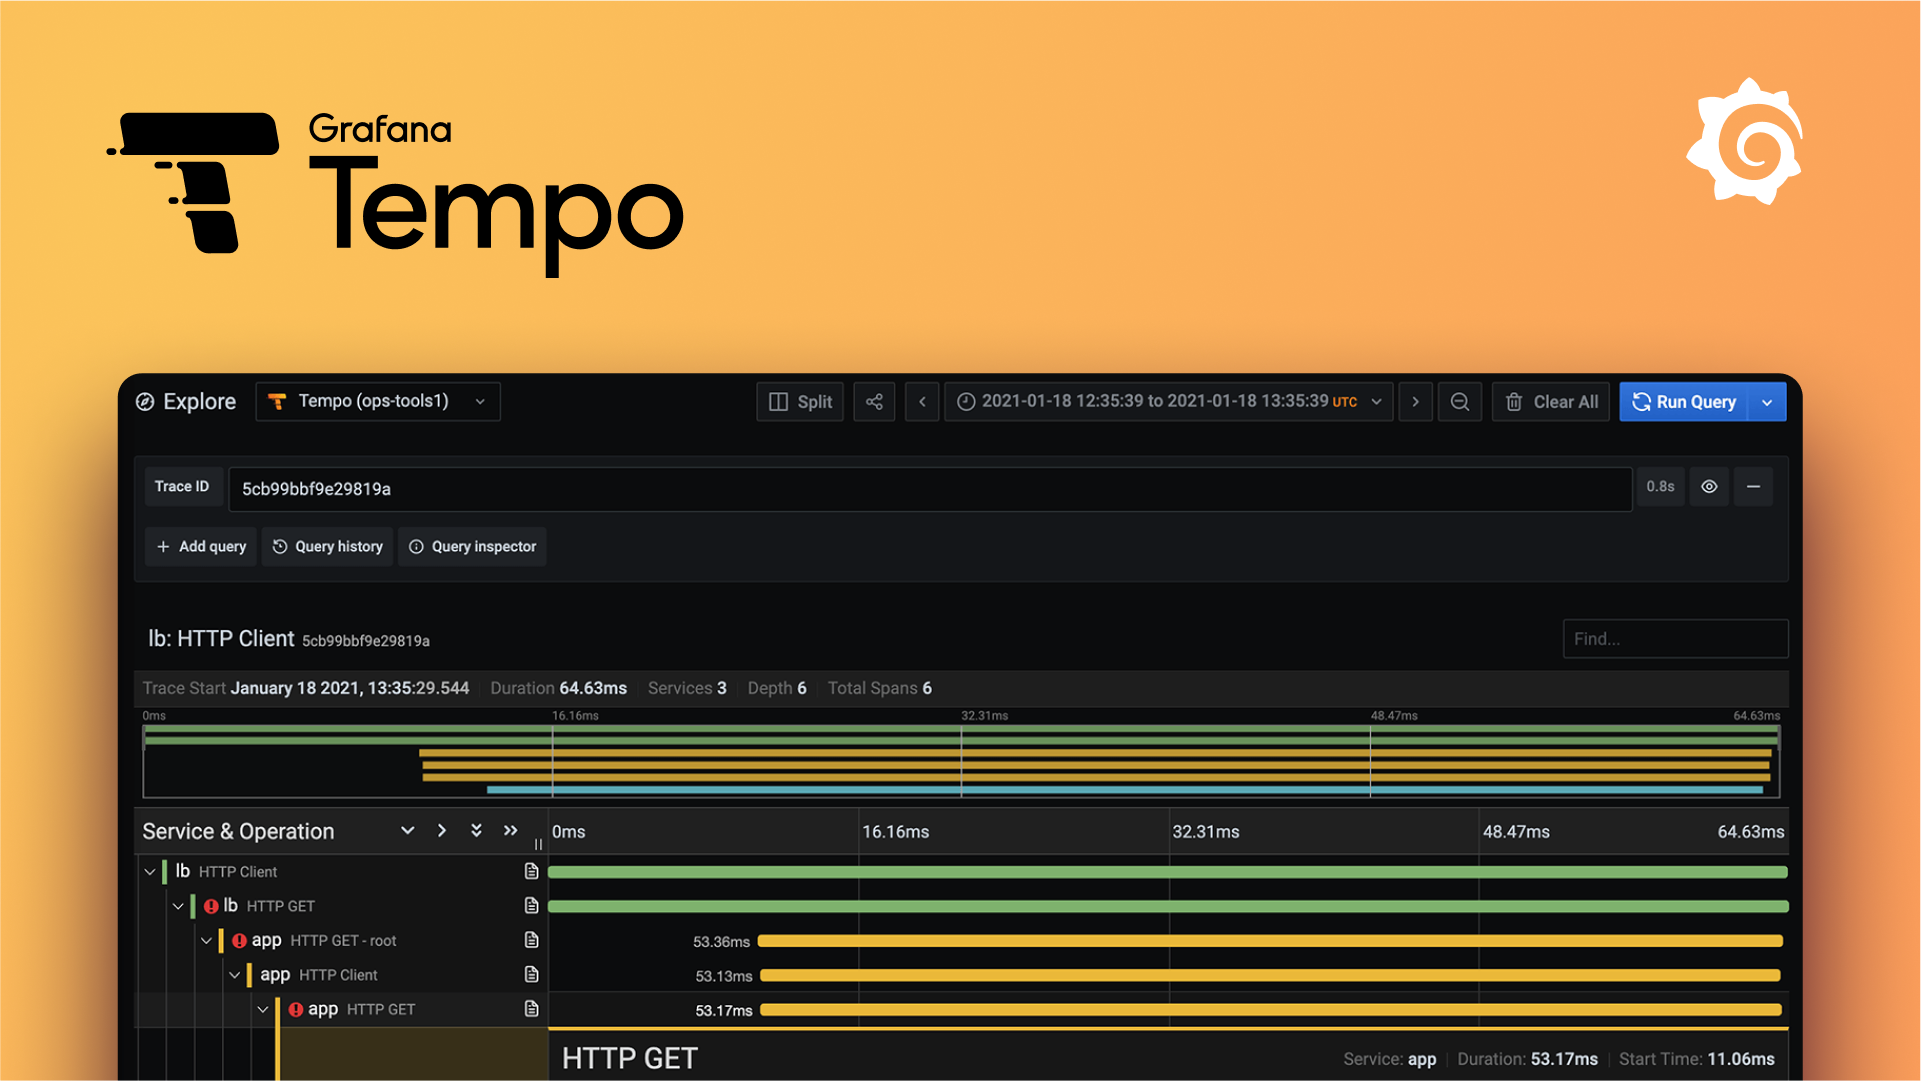
- Since Grafana has a built-in visualization for traces (called "trace viewer"), you can view a single trace’s spans as a waterfall diagram which makes it easy to see the time taken by each span and find where delays might be occurring in your distributed system.
Conclusion
Configuring Grafana Tempo as a distributed tracing backend and using the OTEL Collector as a central telemetry processing agent can significantly enhance the observability of your microservices architecture. Grafana Tempo’s scalability and cost-efficiency make it an excellent choice for storing and querying large volumes of trace data. The integration between Grafana and Tempo allows you to visualize traces seamlessly within your existing Grafana dashboards.
With these tools, you are well-equipped to tackle the complexities of distributed tracing, making it easier to monitor, debug, and optimize your applications. Start by setting up Grafana Tempo and the OTEL Collector today, and unlock deeper insights into your application’s performance and behavior.
We hope this guide has been helpful. Happy tracing!
Next Steps
To dive deeper into Grafana Tempo and OpenTelemetry, consider checking out the official documentation for Grafana Tempo (here) and the OTEL Collector (here).
Lily and 4 people like this